If day trading were a battlefield, indicators would be your weapons of precision. Whether you’re scalping the Nifty 50 or riding momentum in Bank Nifty, having the right indicators on your chart can mean the difference between a quick profit and a painful loss.
In this deep-dive guide tailored for the Indian stock market, we’re uncovering the top indicators for day trading, explaining exactly how to use them, and sharing real-world examples of profitable setups. Whether you’re a beginner or an advanced trader looking to sharpen your edge, this is your ultimate cheat sheet.
Why Indicators Matter in Day Trading?
Day trading is all about timing, speed, and accuracy. Indicators provide visual cues that:
- Help you spot entries and exits
- Confirm price movements
- Filter out noise
- Avoid overtrading based on emotions
But using too many indicators? That’s a recipe for confusion. The secret is in using a smart combo of 2–3 indicators that complement your trading style.
📊 Top 6 Best Indicators for Day Trading
1. Exponential Moving Average (EMA)

✅ What It Does:
Tracks the average price of a stock over a set period—giving more weight to recent prices. The 9 EMA and 21 EMA are golden for day traders.
🧠 How to Use It:
- Buy when 9 EMA crosses above 21 EMA
- Sell when 9 EMA crosses below 21 EMA
- Use EMAs to identify trends, reversals, and dynamic support/resistance
📍 Example Setup:
- Nifty50 5-min chart: 9 EMA crossover above 21 EMA → Strong intraday uptrend confirmation
2. Relative Strength Index (RSI)

✅ What It Does:
Measures the strength and speed of price movements. Helps identify overbought or oversold conditions.
🧠 How to Use It:
- RSI > 70 = Overbought (possible reversal)
- RSI < 30 = Oversold (possible bounce)
- Use 14-period RSI for day trading on the 5- or 15-min chart
📍 Pro Tip:
Watch for divergence (price making higher highs, RSI making lower highs)—a strong reversal signal!
3. Volume
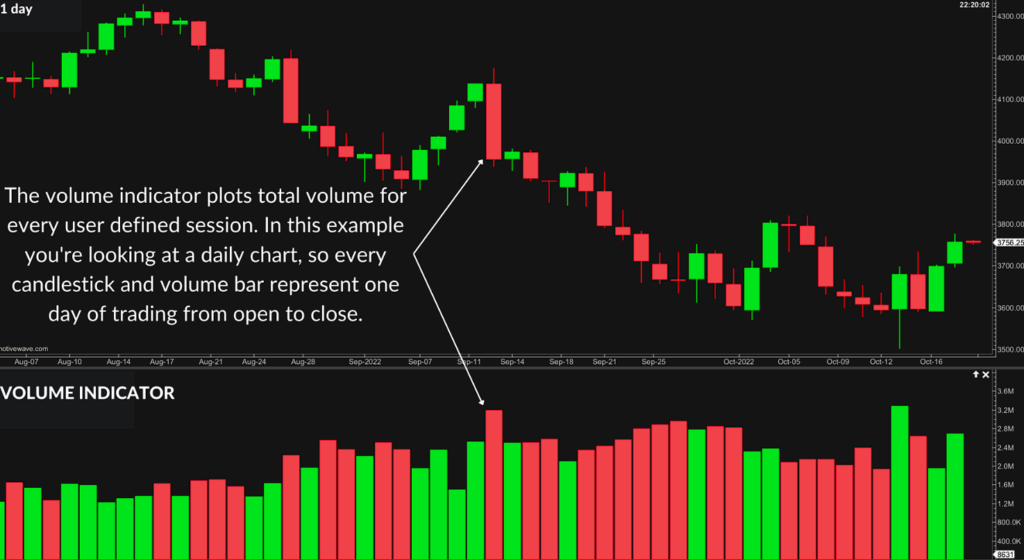
✅ What It Does:
Shows how many shares/contracts are being traded. Volume is the fuel behind price action.
🧠 How to Use It:
- Look for high volume spikes during breakouts
- Avoid low-volume trades—no crowd = no movement
- Combine with candles to confirm strong price moves
📍 Example:
If a breakout candle forms above resistance with above-average volume, it’s likely to be a genuine breakout.
4. VWAP (Volume Weighted Average Price)
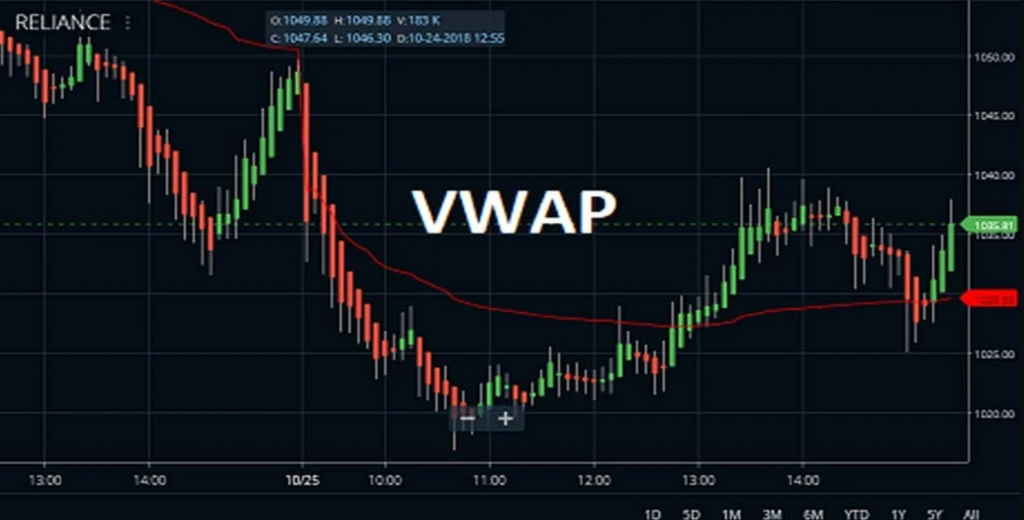
✅ What It Does:
Shows the average price a stock has traded at throughout the day, based on both price and volume.
🧠 How to Use It:
- If price is above VWAP: bias is bullish
- If price is below VWAP: bias is bearish
- Acts as intraday support/resistance
📍 Ideal Strategy:
Buy on pullback to VWAP in an uptrend; sell on rejection from VWAP in a downtrend.
5. Bollinger Bands
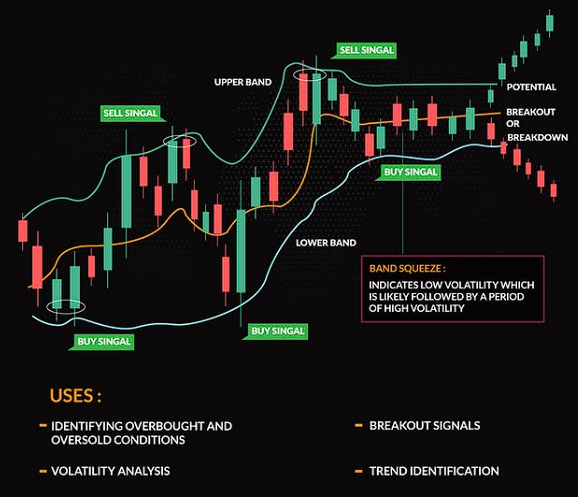
✅ What It Does:
Measures volatility using a moving average and two standard deviations.
🧠 How to Use It:
- Price near upper band = potential reversal or breakout
- Price near lower band = potential bounce
- Bands squeeze = low volatility, expect big move soon
📍 Scalping Trick:
Use Bollinger Band + RSI to confirm momentum trades.
6. MACD (Moving Average Convergence Divergence)
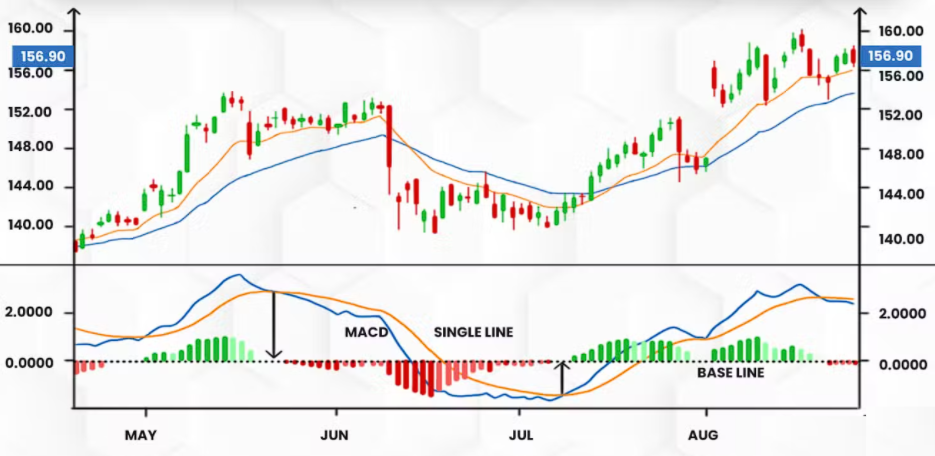
✅ What It Does:
A momentum indicator that shows trend strength and potential reversals using 2 EMAs.
🧠 How to Use It:
- Buy: MACD line crosses above Signal line
- Sell: MACD line crosses below Signal line
- Works well on 15-min timeframes for confirmation
📈 Best Indicator Combinations for Day Trading Success
| Strategy Name | Indicators Used | Ideal For | Timeframe |
|---|---|---|---|
| Trend Follower | 9 EMA + 21 EMA + RSI | Catching directional moves | 5-min |
| VWAP Bounce | VWAP + RSI | Intraday support/resistance scalping | 3-min |
| Breakout Strategy | Volume + Bollinger Bands | Entry on range breakout | 15-min |
| Reversal Setup | RSI Divergence + MACD | Spotting trend exhaustion | 5-min |
⚠️ Avoid the “Indicator Overload Trap.” Too many tools on your chart leads to analysis paralysis. Stick to 2–3 that align with your strategy.
🛠️ Tools and Platforms for Indian Day Traders
To implement these indicators effectively, use platforms with real-time data and customization options.
✅ Recommended Platforms:
- TradingView India – Best for indicator stacking, alerts, and visual clarity
- Zerodha Kite – Lightweight, fast, and good for placing trades
- Chartink – Screener tool for indicator-based scanning
- FYERS One – For advanced traders wanting desktop-level speed
🧮 Real-World Example: Using 3 Indicators Together
Let’s say you’re trading ICICI Bank on expiry Thursday.
- Price is above VWAP (bullish bias)
- RSI is rising but still below 70 (room to move)
- 9 EMA crosses above 21 EMA
✅ You enter the trade
🎯 Target = previous swing high
🛑 SL = just below VWAP
💰 Result = Smooth ₹3–₹5 per share movement in minutes
📘 Backtest Before You Deploy
Even the best indicators won’t work if you’re shooting blind. Here’s how to test:
- Backtest last 30–50 days of setups
- Track win ratio, reward:risk, and consistency
- Journal what works and where you hesitate
Use tools like:
- NSE India Bhavcopy
- Backtest-Rookies (Excel-based backtesting)
- TradingView Replay Mode
⚠️ Common Mistakes Traders Make with Indicators
| Mistake | Why It’s Dangerous |
|---|---|
| Relying on a single indicator | No context = poor accuracy |
| Ignoring volume | Volume confirms the move |
| Trading every signal | Not every cross = good trade |
| Changing indicators frequently | No consistency = no edge |
Conclusion: Indicators are Tools, Not Magic Wands
Indicators are meant to guide, not decide. A profitable day trader uses them like a sniper uses a scope—to improve aim, not pull the trigger blindly.
So, if you’re serious about turning intraday signals into solid profits, choose 2–3 indicators that resonate with your strategy, master them, and combine them with sound risk management.
Want to Learn How Profitable Traders Use These Indicators?
Join the ₹99 video course “How to Start Trading – 5 Screener Strategies” on WealthInFocus.com by Rajeev Bansal.
Inside, you’ll get access to real-life screeners, indicator-based setups, and risk-managed entry plans designed for the Indian market.
It’s time to stop guessing and start trading with clarity.